Find every faulty module. Before it costs you money.
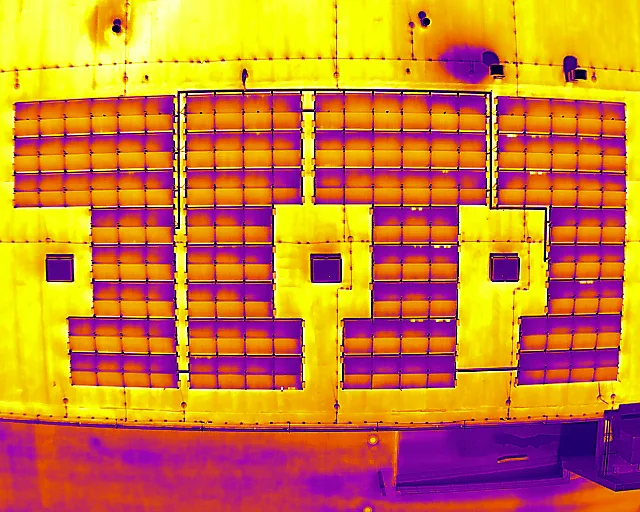
You fly your system with a thermal drone – we deliver the standards-compliant inspection report within 24–72 h: health score, finding and GPS coordinate for every module, lost yield in €/year.
Every system has faults. Yours too.
Your inverter doesn't show you most of them.
New systems: hand over safely, secure your warranty.
One in thirty modules is already flagged ex works. Document the condition before the warranty runs out.
Existing and ageing systems: win back lost yield.
Monitoring only sees the total. Thermography shows you which module you need to replace.
An inspection that pays for itself.
More than 125 GW of analysed PV capacity shows it: systems lose an average of 5.08% of their output to undetected faults – and the trend has been rising for years. On a 1 MWp park that's roughly 50,000 kWh a year you could be feeding in, but aren't.
Our inspection costs a fraction of that – and shows you exactly which modules cause the loss. Usually it pays for itself with the first string fault found.
Sources: Raptor Maps Global Solar Report 2026 (5.08% average equipment-related power loss, >125 GW data base) · Kiwa PI Berlin 2025 (3.36% of modules flagged ex works) · BNetzA solar auction, volume-weighted award value 07/2025: 4.84 ct/kWh. Worked example assuming 1,000 kWh/kWp specific annual yield.
* In this specific example – real results vary and are individual to each system. Prices net, excl. VAT.
From the flight to the report
A few steps to a finished inspection report – no thermography expertise required on your side.
Fly the site
Drone flight following a clear, illustrated guide – with free phone support.
Upload
Upload your radiometric thermal images straight from the browser.
AI analysis
Modules are detected, segmented and thermally assessed automatically.
Report in 24–72 h
PDF plus interactive tools for maintenance and repair.
Flight guide: how to capture the data properly
Altitude, overlap, gimbal angle and turning manoeuvres for the Mavic 3T, Matrice 4T(D) and Matrice 30T – condensed into a few pages.
Every fault – named and rated precisely
Assessment of hotspots, bypass faults and PID. Power degradation across the whole system is estimated by Monte Carlo simulation – including lost yield in €/year.
Four severity levels, clearly graded
Every flagged module is categorised by its maximum temperature difference (ΔT) – from a mild anomaly to an acute fire risk.
These are the faults we make visible
Every system fault has a characteristic signature in thermal imagery. A selection – the report names, locates and rates every finding.
Hotspot (cell defect)
criticalCell crack, micro-defect or partial shading from leaves, soiling and lichen. The most common cause of fire.
Bypass diode / substring
highShort-circuited or conducting bypass diode – 33% to 66% yield loss on every affected module.
Overheated junction box
possible fire riskCorroded or loose terminal, high contact resistance in the junction box – a possible fire risk.
Open-circuit string
highBlown fuse, disconnected DC cable or inverter fault – the string delivers no current.
Short circuit / mismatch
highWiring or polarity error, or a short circuit – often present from commissioning onwards.
PID degradation
mediumPotential-induced degradation – a creeping loss of output across whole modules that grows over years.
…and many more: delamination, glass breakage, soiling and lichen, mismatch from module tolerances. We classify every thermally flagged module to IEC TS 62446-3.
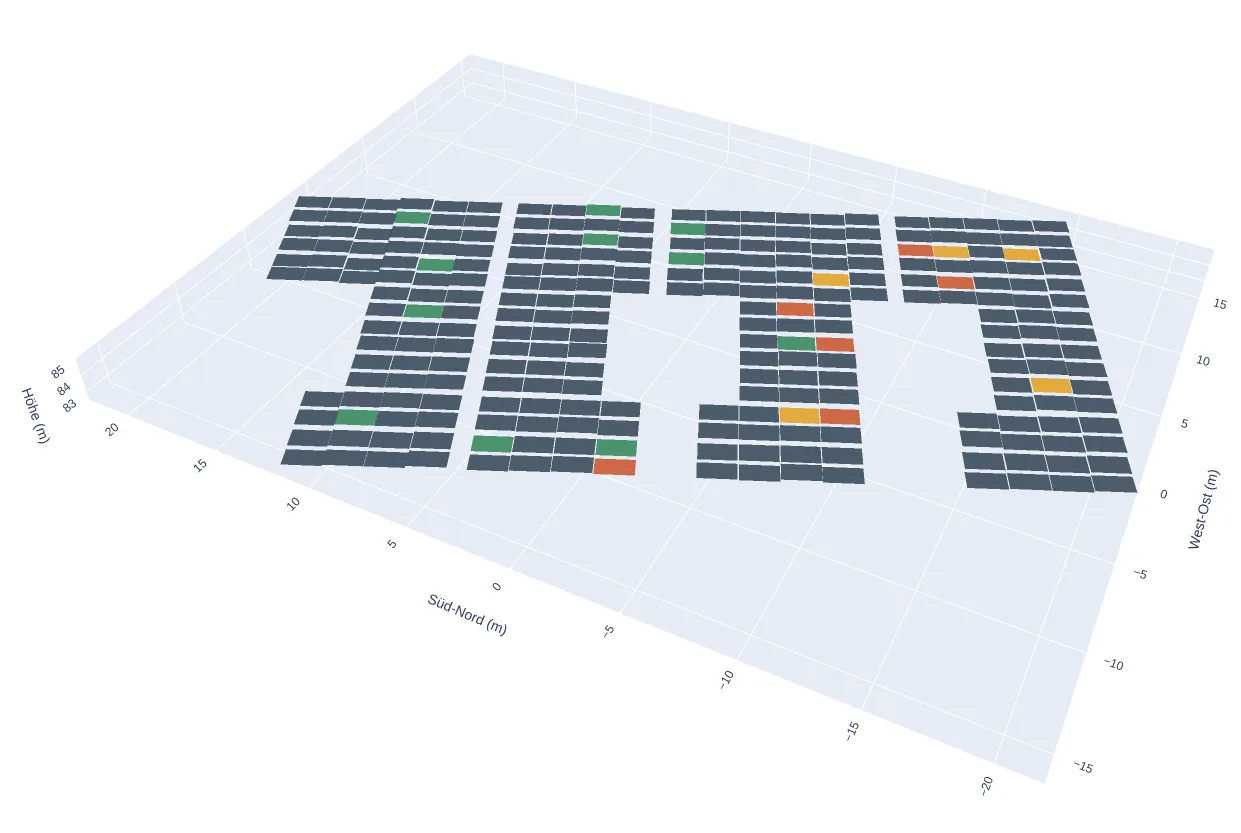
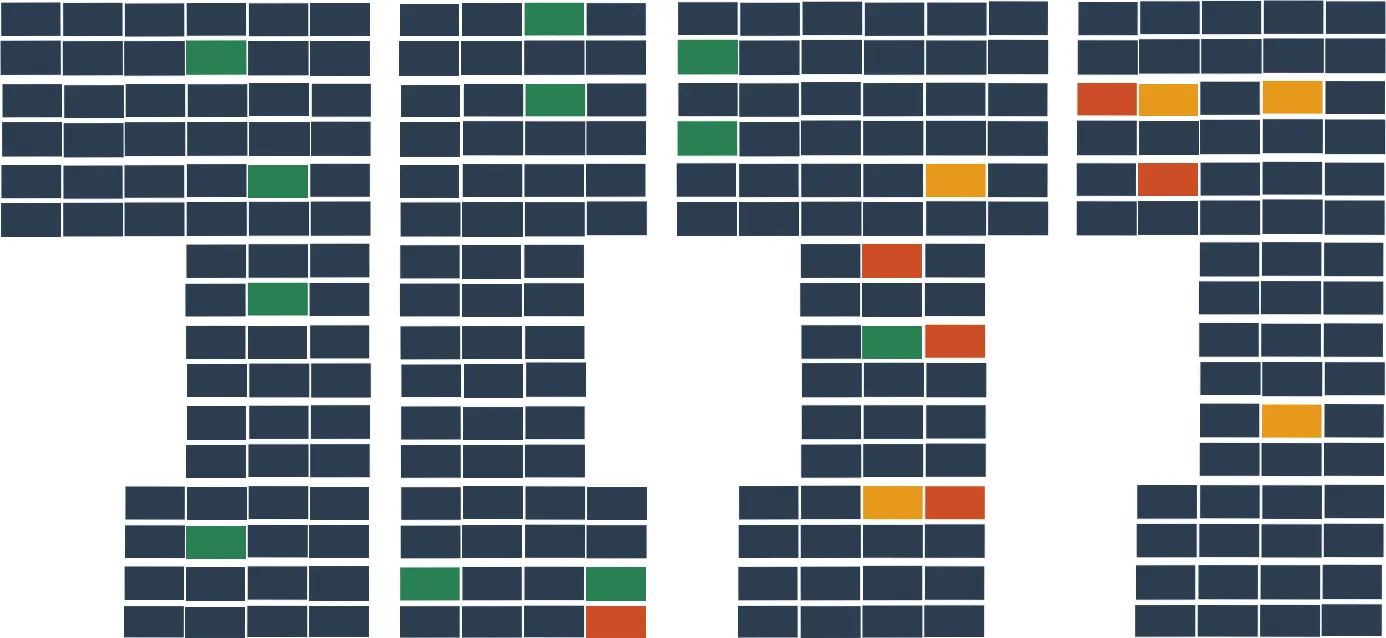
2D map and 3D model of your system
Every flagged module – colour-coded by severity, located exactly in the real system geometry and in the true-to-scale 3D model.
Findings by severity
23 modules assessed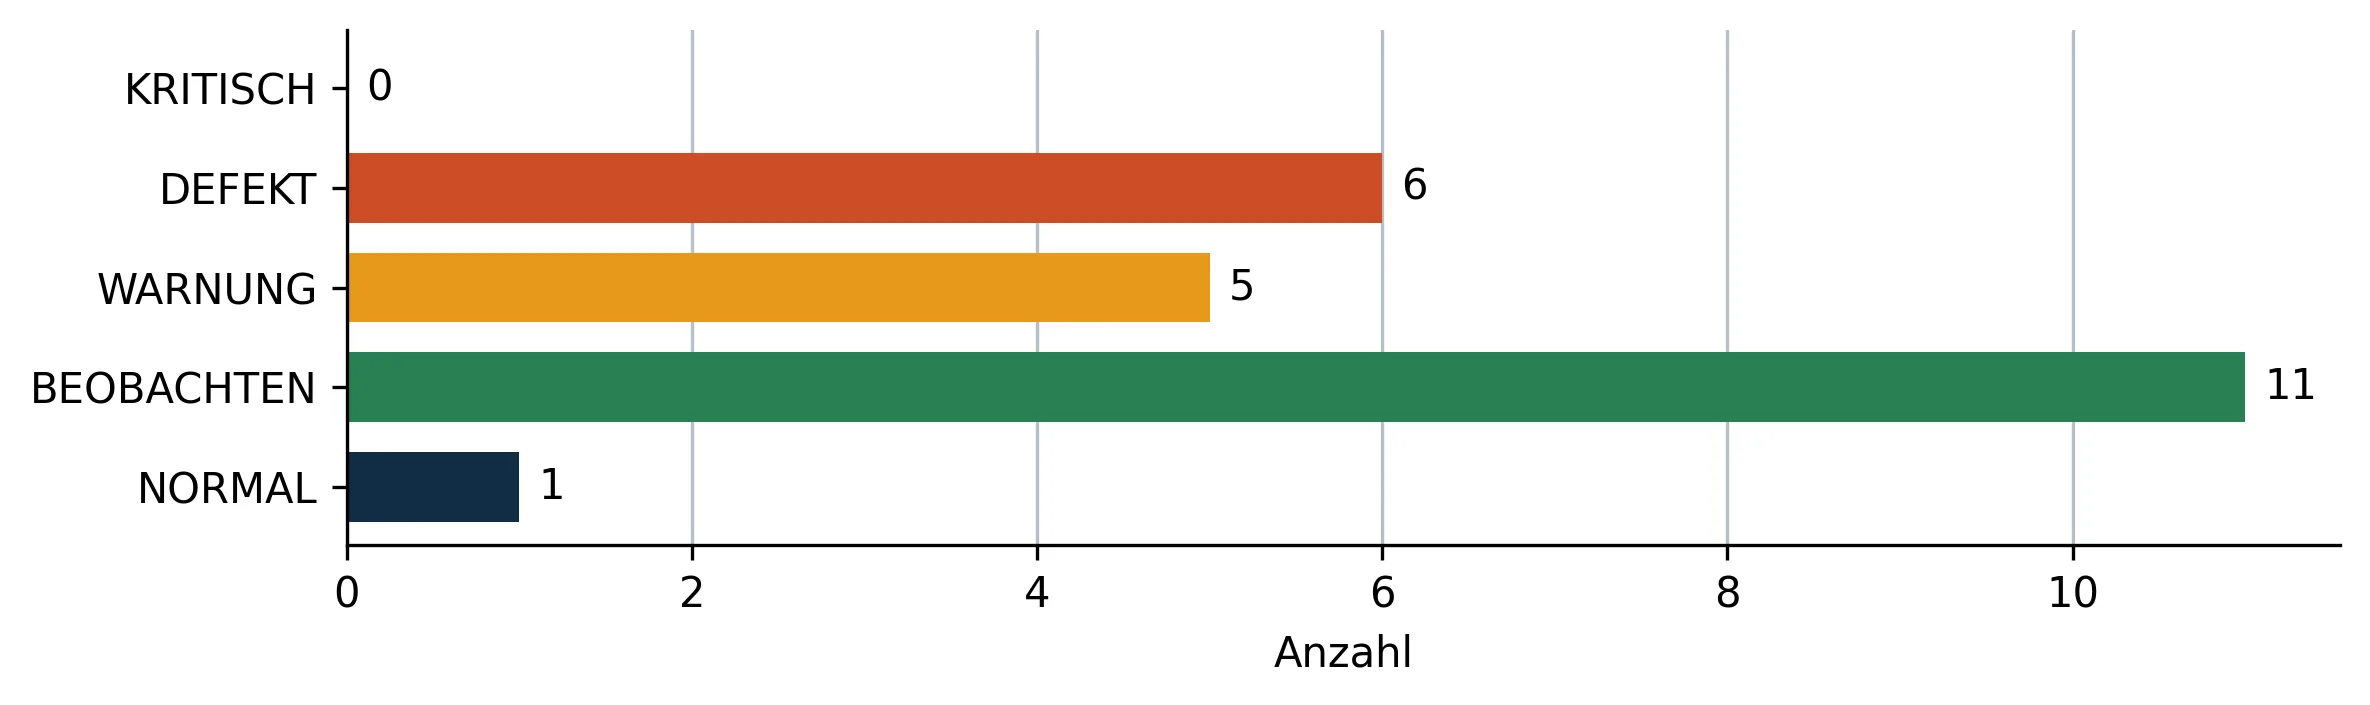
From the real image to the AI analysis
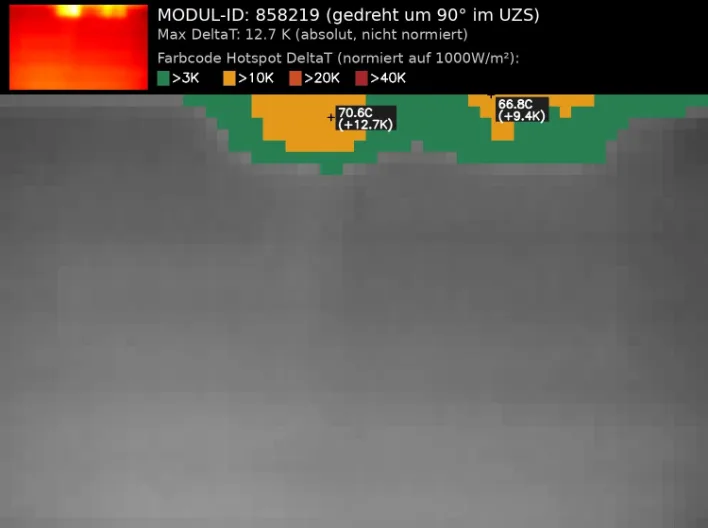
From every radiometric thermal image our AI identifies the module, measures the temperature difference pixel by pixel and classifies each hotspot – normalised to 1000 W/m².
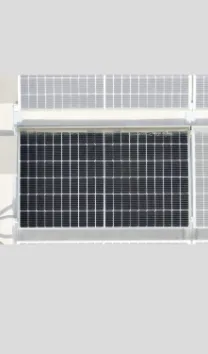
Example: module 858219 with two hotspots (ΔT +12.7 K and +9.4 K) – detected, measured and colour-coded by severity automatically.
Everything for maintenance & repair
The report doesn't stop at the finding. You get the tools to locate and fix every fault on site.
Interactive 3D model
Locate every faulty module in the real system geometry – row, position and orientation at a glance.
GPS & Maps coordinates
Exact GPS coordinates for every flagged module. One click opens Google Maps – your technician finds the module immediately on site.
2D overview maps
Standards-compliant categorisation maps of the whole system – as a work order and for your documentation.
PDF report – sorted by urgency & finding
Every flagged module with its finding, ΔT, severity and GPS coordinate – sorted by urgency so your team works through the critical cases first.
View a sample reportTested to recognised engineering standards
The inspection follows DIN IEC/TS 62446-3 (VDE V 0126-23-3) – outdoor infrared thermography – and the VATh guideline on electrical thermography. Capture parameters are documented and the analysis is signed off by a certified PV service technician.
No subscription. No hidden costs. Just results.
You pay per inspection – transparent fixed prices, payable straight from the request form.
Rooftop system
excl. VAT · for systems up to 100 kWp
Commercial & ground-mount
excl. VAT · up to 1 MWp, then +€150 per additional MWp
All prices net, excl. 19% VAT. The exact amount is calculated from your kWp figure in the form and shown before payment.
Frequently asked questions
Take your PV maintenance airborne
Request your first thermography inspection – standards-compliant, within 24–72 h, including every tool you need for the repair.